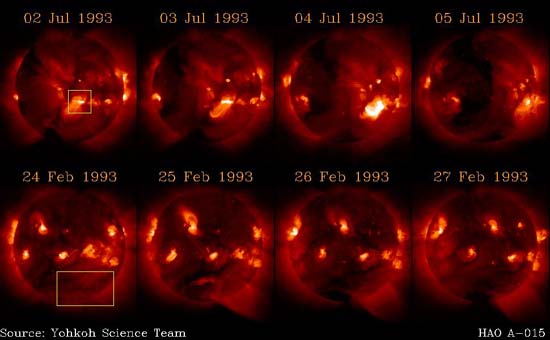
15. Solar activity in X-rays
This slide shows two examples of solar activity as seen in X-rays.
Frames are separated by a time interval of approximately one day.
Solar rotation would carry an active region from the East (left) limb to
disk
center in about seven days. Note, in the first row of images, how
the active region indicated by a yellow box on
July 2![]() 1993, brightens
dramatically from July 3
1993, brightens
dramatically from July 3![]() to
4
to
4![]() ,
and fades back to its original appearance
by the next day. In many instances the brightening (and fading)
is observed to occur on much shorter timescales, and in its swiftest
form represents the most common type of flare. The complexity
and multiple timescales characterizing these types of flaring events
is best appreciated when viewing animations of X-ray images closely
spaced in time.
,
and fades back to its original appearance
by the next day. In many instances the brightening (and fading)
is observed to occur on much shorter timescales, and in its swiftest
form represents the most common type of flare. The complexity
and multiple timescales characterizing these types of flaring events
is best appreciated when viewing animations of X-ray images closely
spaced in time.
The sequence shown on the bottom row is an example of a class of less energetic X-ray events occurring on much larger spatial scales, commonly seen following coronal mass ejections. Note how a structure that resembles the base of a helmet streamer (compare with slide #12) develops in the SW (lower right) quadrant. The relatively faint X-ray emission is believed to be associated with the dissipation of magnetic energy, occurring as magnetic fieldlines blown open by the mass ejection reconnect and close up again over the ejection site, eventually leading to the formation of a new helmet streamer.