4. Solar magnetogram
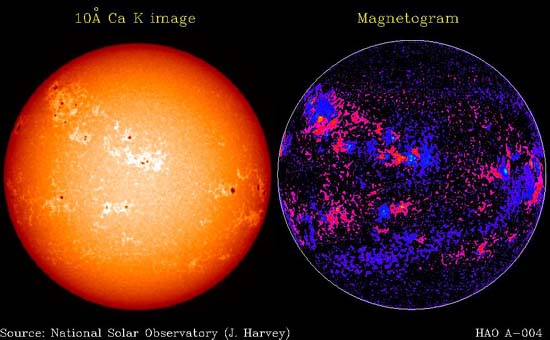
The nature of sunspots was put on firmer physical grounds at
the beginning of the 20![]() century, when it was determined spectroscopically that sunspots
were the seat of strong, concentrated magnetic fields. The
image on the left is a magnetogram. Magnetograms are synthetic
images constructed by measuring the magnetic field along the line of
sight
at a given location
on the solar surface, and assigning a color according to the
field strength; the pink-red-yellow sequence corresponds to
increasingly strong
positive normal magnetic field component, or magnetic
fieldlines pointing away from the Sun, and the purple-blue-light blue
sequence to increasingly strong negative field,
i.e. magnetic fieldlines pointing into the Sun.
Upon comparing this magnetogram to the Calcium image
on the left, one sees that regions of strongest
magnetic fields (yellow and light blue on the magnetogram) always
coincide
with sunspots. Diffuse magnetic fields of lesser strengths
are also present all over the solar surface, with moderately
strong (
century, when it was determined spectroscopically that sunspots
were the seat of strong, concentrated magnetic fields. The
image on the left is a magnetogram. Magnetograms are synthetic
images constructed by measuring the magnetic field along the line of
sight
at a given location
on the solar surface, and assigning a color according to the
field strength; the pink-red-yellow sequence corresponds to
increasingly strong
positive normal magnetic field component, or magnetic
fieldlines pointing away from the Sun, and the purple-blue-light blue
sequence to increasingly strong negative field,
i.e. magnetic fieldlines pointing into the Sun.
Upon comparing this magnetogram to the Calcium image
on the left, one sees that regions of strongest
magnetic fields (yellow and light blue on the magnetogram) always
coincide
with sunspots. Diffuse magnetic fields of lesser strengths
are also present all over the solar surface, with moderately
strong (![]() Gauss) fields most
often associated with plages.
Field strengths in sunspots
are in the range 1000---4000 Gauss, with the stronger fields in the
larger
sunspots; this is much larger than the average 0.5 Gauss of the Earth's
surface magnetic field. What is perhaps even more striking is the
topological complexity of the solar magnetic field;
Unlike on the Earth's surface where the essentially dipolar magnetic
field defines rather unambiguously a magnetic north and south,
on the solar surface a compass would be rather
useless for orientation purposes.
Gauss) fields most
often associated with plages.
Field strengths in sunspots
are in the range 1000---4000 Gauss, with the stronger fields in the
larger
sunspots; this is much larger than the average 0.5 Gauss of the Earth's
surface magnetic field. What is perhaps even more striking is the
topological complexity of the solar magnetic field;
Unlike on the Earth's surface where the essentially dipolar magnetic
field defines rather unambiguously a magnetic north and south,
on the solar surface a compass would be rather
useless for orientation purposes.